It took Google knowledge panels one month and twenty days to update following the inception of a new CEO at Citi, a F100 company. In Diffbot’s Knowledge Graph, a new fact was logged within the week, with zero human intervention and sourced from the public web.
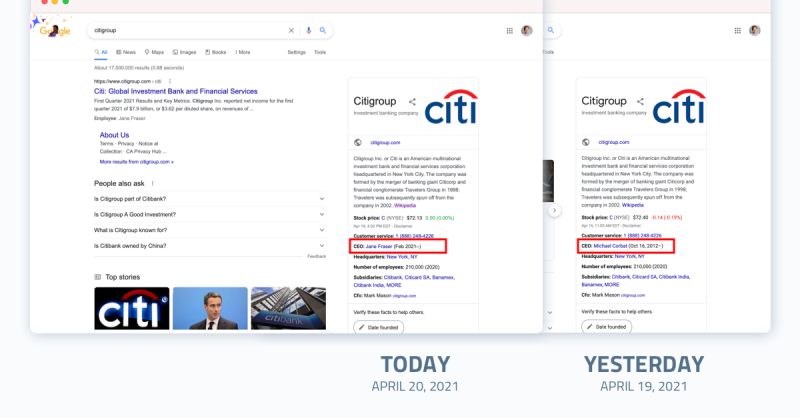
The CEO change at Citi was announced in September 2020, highlighting the reliance on manual updates to underlying Wiki entities.
In many studies data teams report spending 25-30% of their time cleaning, labelling, and gathering data sets [1]. While the number 80% is at times bandied about, an exact percentage will depend on the team and is to some degree moot. What we know for sure is that data teams and knowledge workers generally spend a noteworthy amount of their time procuring data points that are available on the public web.
The issues at play here are that the public web is our largest — and overall — most reliable source of many types of valuable information. This includes information on organizations, employees, news mentions, sentiment, products, and other “things.”
Simultaneously, large swaths of the web aren’t structured for business and analytical purposes. Of the few organizations that crawl and structure the web, most resulting products aren’t meant for anything more than casual consumption, and rely heavily on human input. Sure, there are millions of knowledge panel results. But without the full extent of underlying data (or skirting TOS), they just aren’t meant to be part of a data pipeline [2].
With that said, there’s still a world of valuable data on the public web.
At Diffbot we’ve harnessed this public web data using web crawling, machine vision, and natural language understanding to build the world’s largest commercially-available Knowledge Graph. For more custom needs, we harness our automatic extraction APIs pointed at specific domains, or our natural language processing API in tandem with the KG.
In this paper we’re going to share how organizations of all sizes are utilizing our structured public web data from a selection of sites of interest, entire web crawls, or in tandem with additional natural language processing to build impactful and insightful dashboards par excellence.
Note: you can replace “dashboard” here with any decision-enabling or trend-surfacing software. For many this takes place in a dashboard. But that’s really just a visual representation of what can occur in a spreadsheet, or a Python notebook, or even a printed report.
Overview
The three dashboard-enhancing use cases we see the most regularly at Diffbot include use cases for market intelligence, news monitoring, and lead generation or enrichment. Additionally, when organizations can find a great deal of their most valuable data online, these methods can be combined in powerful ways we’ll tackle in the final section of this paper.
- Structured Web Data For Market Intelligence (p. 5)
- Structured Web Data For News Monitoring (p. 13)
- Structured Web Data For Lead Generation And Enrichment (p. 18)
- Pulling It All Together (p. 23)
You must be logged in to post a comment.