The public web is chock full of indicators with implications for stock prices, commodities prices, supply chain issues, or the general perceived value of an entity. But how do you reliably get these market indicators?
You can search online… and slog through the most popular pages that all your competitors have also looked at. Or you can read a commentator’s take. And likely stay one step removed from the actual information you should be dealing in.
Or you could deal directly with all of the articles on the web. Each annotated with helpful fields you can filter through like sentiment scores, AI-generated topic tags, what country the article was published in, and many others. That’s where Diffbot’s Knowledge Graph (KG) comes in.
The news index of Diffbot’s KG is 50x the size of Google News’ index. And each article entity in the KG is populated with a rich set of fields you can use to actually search the entire web (not just the portion of the web who paid to get in front of you).
In this guide we’ll work through how to set up a global news monitoring query in the KG. And then schedule this query to repeat and email you when new articles surface.
The time this will take… about 10 minutes.
Pre-Requisites
- A Diffbot account – Sign up for a free trial or login to follow along.
- Some familiarity with DQL (Diffbot Query Language) will make for easier skimming.
More of a visual learner? Check out our video on this topic below.
Step One: Initial Exploration of A News Topic
I’ve included a video of all of these steps above that utilizes the topic of corn futures. That is, the commodity market wherein the right to purchase corn at a specific price at some future point is bought and sold. Futures markets are notoriously volatile. And fortunes are made and lost nearly every day.
It likely goes without saying, but any extra information can be the difference between an informed and uninformed futures trade (or any trade, for that matter).
So where should we begin? Once you log into the Diffbot dashboard, you’ll want to click “search” which takes you to the visual query editor of the Diffbot Knowledge Graph.
Next — because we’re tracking news here — select “article” as the entity type. I’ll note here that below we provide sample DQL queries. But all queries throughout the first section of this article can also be achieved with the visual query editor.
Now for a few initial exploratory queries. What you’re looking for here is a balance of a few factors.
- You want your search to be granular enough so that the articles returned are useful (we want articles on corn market indicators, not articles about corn tortillas)
- You don’t want to drown in data. You want a number of articles that cooperates with your analysis methods. If you’re analyzing these articles in a spreadsheet you may only want a handful of articles at a time. If you’re sending the articles to your data team maybe you can handle thousands or millions.
- On the flip side, you don’t want your query to be so specific that no new articles are being returned on the topic.
The opportunity from tracking indicators grows over time, and we’ll be creating a regularly scheduled article query in this tutorial. So the idea here is that we spend enough time honing our query so that it provides enough information to be useful, is targeted, and doesn’t drown us in data.
It typically makes sense to start general and work your way to specificity. A Knowledge Graph query starting:
View In Knowledge Graphtype:Article
Returns all article entities in the Knowledge Graph. Each following component of the DQL query will narrow what is returned by heightening the specificity of the query.
So if we’re interested in indicators about corn futures, let’s start by seeking out articles that contain the word “corn” and that are published in the nation that produces the most corn in the world.
💡 Pro Tip: Unlike traditional search engines, Diffbot’s Knowledge Graph is unsiloed by language or region. Use the publisherCountry and language parameters to get more granular results from across the world.
View In Knowledge Graphtype:Article publisherCountry:"United States" text:"corn"
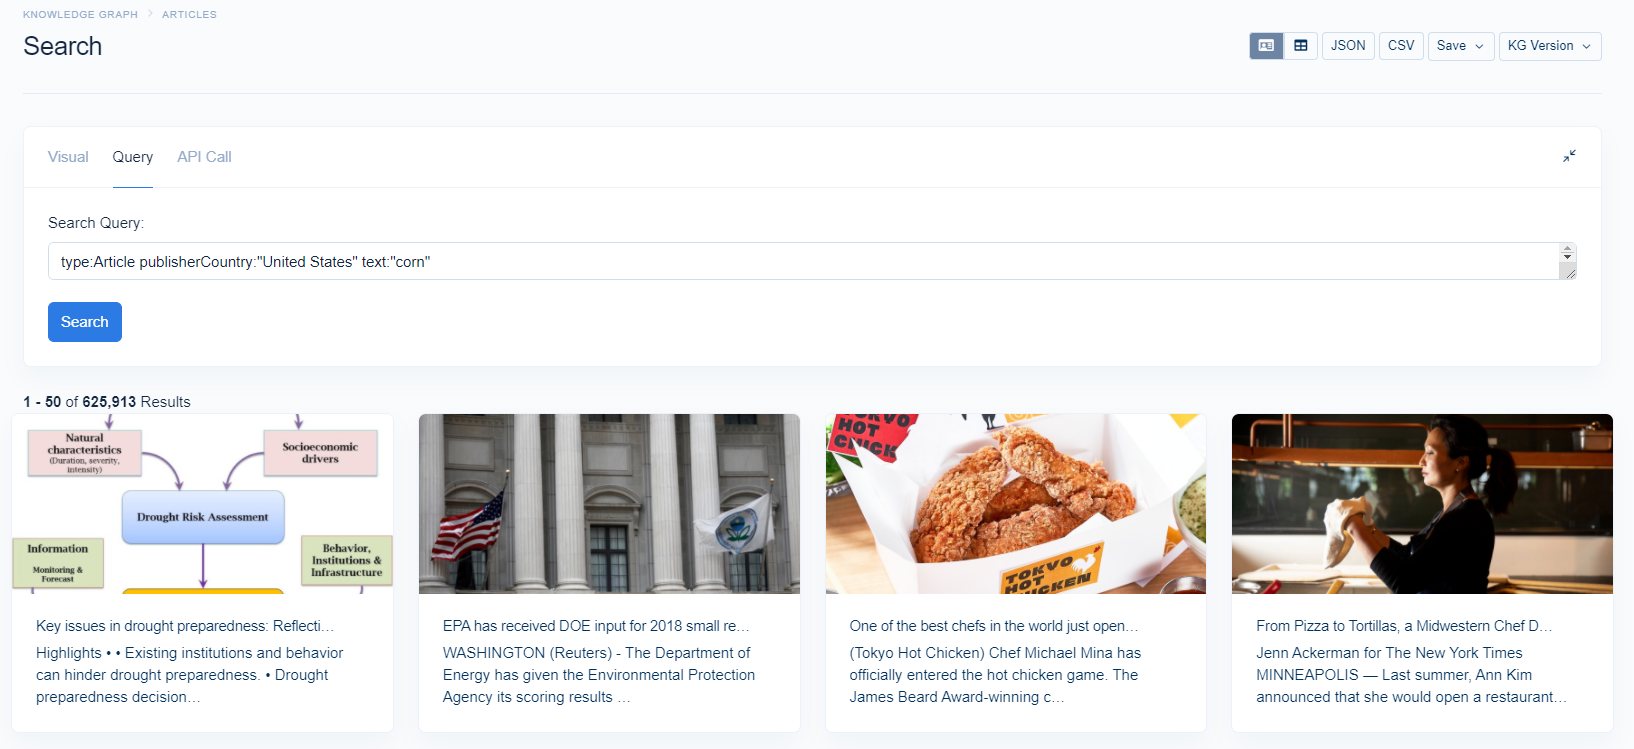
This returns less articles, but still over 600,000. This may be fine for data teams utilizing the Knowledge Graph API, but our article query scheduler returns results in the form of an Excel sheet or csv. So this is way too many results to be useful in that format.
Articles within the Knowledge Graph aren’t presented in the order of the most popular content, paid content (ads), or because an organization spent time optimizing their SEO. This means you have the power to curate exactly what articles you’re seeing. Articles aren’t hidden behind the results of a few popular domains, or a few wealthy organizations. This is great for many applications. But means you have to be a bit craftier in how you search.
To narrow this search, let’s take a look at another feature of the Knowledge Graph: AI-generated topic tags.
All articles within our Knowledge Graph have been processed by our Automatic extraction APIs. These are AI-enabled web data extractors that are able to pull data from pages without knowing the structure of the page in advance. While this enables the flexibility to crawl a vast majority of the web and pull structured data, this also means that the categories extracted articles are placed into are flexible and change over time. This means you have to check to see whether a tag exists.
Let’s see if the tag “Futures market” exists.
View In Knowledge Graphtype:Article publisherCountry:"United States" text:"corn" tags.label:"futures market"
It does, and it returns over 2,000 articles! This may not be exactly what we’re looking for in this hypothetical example (we’re seeking indicators rather than coverage of past corn future market events). But this query parameter is worth noting for many news monitoring applications.
So let’s alter our query one more time. Note that if you’re editing in DQL you can use ternary operators like “or” and “not” for these article search parameters. Within the visual editor the conditions you add will function like an “and.”
View In Knowledge Graphtype:Article publisherCountry:"United States" text:"corn" text:"production"
Thus the above query looks for article entities that contain the word “corn” AND the word “production.” This heightens the specify of our original query and returns about a third of the original 600k articles.
View In Knowledge Graphtype:Article publisherCountry:"United States" text:"corn" text:"production" date>"2020-12-01"
After adding a date parameter to only return articles since the start of December, we’re down to a more manageable 160 results. Skimming the top few, we may also be on to some corn futures indicators with topics like USDA appointments, corn exports, and climate change covered.
Step 2: Sentiment Analysis and Freshness
Thus far we’ve taken our original query and gotten it down to 160 articles about corn production from December of 2020. So how can we make this commodity indicator search more valuable?
We limited our queries above to those that can be replicated in the Knowledge Graph’s visual query editor. But if you know Diffbot Query Language or are willing to give it a try, you can gain even more control over your Knowledge Graph queries.
View In Knowledge Graphtype:Article publisherCountry:"United States" text:"corn" date<31d
First, we can change our absolute date to a relative date. Feel free to change the tag to anything you find useful. The syntax is simple; date<31d where “d” is “days” and “<” means “less than X days old.” When we schedule a recurring query this should keep our results fresh.
Secondly, we can specify the sentiment of the articles we want returned. Sentiment scores within the Knowledge Graph range from -1 (very negative) to 1 (very positive). This is powerful for something like an stock or commodity indicator. Let’s say we’re on the look out for extremely negative announcements about corn production. Simply add sentiment<-.5 to your query.
View In Knowledge Graphtype:Article publisherCountry:"United States" text:"corn" text:"production" date<31d sentiment<-.5
This has us down to four articles for this time period. Note that most articles don’t have as extreme of a sentiment. If you want more you should likely stay away from extremely positive or negative. But it’s useful to get a quick view of indicators.
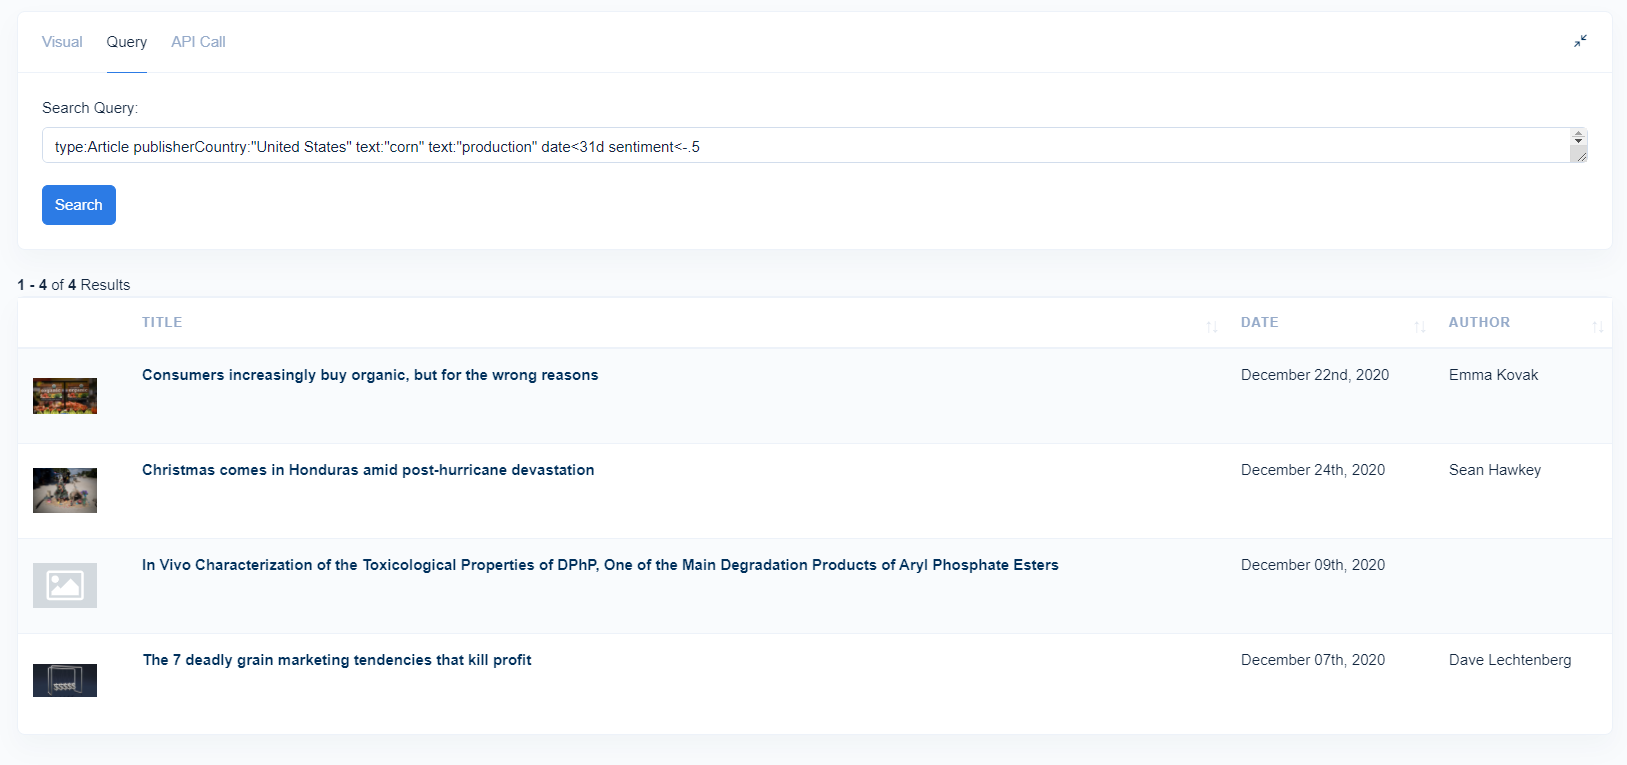
In this case it looks like we’re spot on for a quick survey of conditions that may affect corn markets, with results on poor grain marketing practices, a study on toxicity in the environment, coverage of a hurricane, and a change in consumer habits.
Step 3: Schedule Your Query For Regularly Updated News Monitoring
For the final step you’ll want to head over to your Diffbot Excel Add-In, or our mini-app for scheduling article queries.
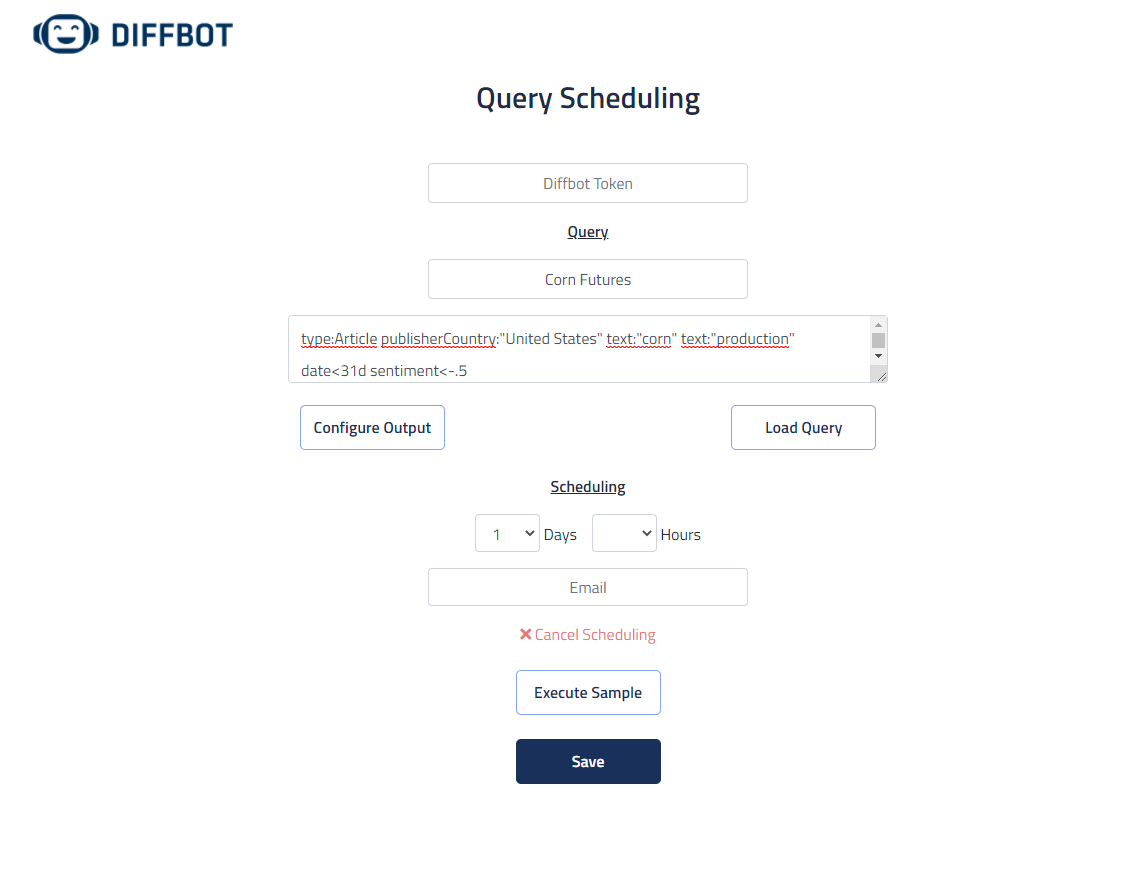
Shown within the mini-app, you’ll simply paste your DQL query, select the time increment at which you want updates, and enter your email. Configure what format you want the results sent you to take and click save to keep tabs on a market entity of your choice!
You must be logged in to post a comment.