Skip Ahead
- Calculating Total Addressable Market (TAM) Using Diffbot's Knowledge Graph
- Extrapolating From Lists of Customers, Competitors, or Suppliers
- Calculating Market Share And Saturation With Diffbot's Knowledge Graph
- Ranking Competition With Net Income Per Employee
- Gauging Organization Sentiment
- Tracking Shifts In Talent
- Market Intelligence Dashboards With Diffbot
Market intelligence is the tracking and analysis of all important parties within a given market. In particular, market intelligence commonly looks at competitors, suppliers, governmental agencies, product offerings, customers, and broader trends.
Market intelligence can inform a range of tasks including (but not limited to):
- Minimizing risk of new investments
- Identifying new markets to enter
- Increasing market share
- Informing (or updating) ideal customer segments
- Developing brand positioning
- Assessing risks or opportunities in supply chain and production
In this quick guide we’ll work through reasons why the following market intelligence metrics are important, as well as how to gain market intelligence insights with Diffbot’s Knowledge Graph.
Calculating Total Addressable Market (TAM) Using Diffbot’s Knowledge Graph
Smart investors and management teams lean back on total addressable market (TAM) and related measurements to discern what level of opportunity a given service set has. A total addressable market is a measurement depicting the total potential sales given complete market saturation and with no monetary (or otherwise) constraints in providing this many services. Accurate TAM assessments can provide an early guidepost for product market fit as well as where opportunities are.
There are three primary routes to determine TAM, each with a set of trade-offs.
The “top down” method, looks at a well established industry as a whole. This form of research typically relies on analyst firms as middle men, and can enable you to say something like “Gartner estimates solar panel sales could reach X by Y.” This is a fine starting point and a bit of a gut check, but this method typically relies on the trust in a particular research firm and doesn’t provide a ton of detail about how results were created (or the underlying data set).
The “bottom up” method is a great choice for organizations who have already sold some of their products. It enables you to do your own research and understand the nuances of the underlying data. In the bottom up method you’ll take your annual contract value and multiply it by the number of organizations who fit a specific firmographic profile. This can enable you to gain a set of granular and related data points. For example, the TAM of solar energy in Texas (versus, say, Arizona).
The “value-theory” method adjusts the annual account value input to a TAM by providing an educated guess as to what individuals “could” be willing to spend for the value of your product. This can be accomplished by looking at competitors, or combining the value of multiple markets in the event your service is creating a new category.
For our purposes here, we’ll jump into the “bottom up” method, which provides the most underlying data and can be constructed “in house.”
Diffbot’s Knowledge Graph has unrivaled longtail and midmarket coverage for organizations through our web-wide fact extraction. The inclusion of a range of firmographics, technographics, and employee demographics allows for uniquely granular and accurate calculation of TAM values.
In our hypothetical, let’s calculate TAM for a company that makes backup energy sources for hospitals. They serve two primary industry segments. For community and mid-sized city hospitals that tend to have 500 or less employees, they provide backup energy monitoring and maintenance for a price of $5,000 a year. For larger hospitals that can have thousands of employees, their average annual contract value is $100,000 a year.
Within the Knowledge Graph we can start by assessing the underlying data on hospitals. Our initial query returns over 26,000 organizations who have been tagged as operating in the “hospitals” industry. This seems a bit high, and upon some perusal we can see some optometric, physical therapy, and related industries that are to some degree “hospitals” but not what we’re looking for. We then exclude organizations with these industries and provide a summary view of the number of employees of each one of these organizations.
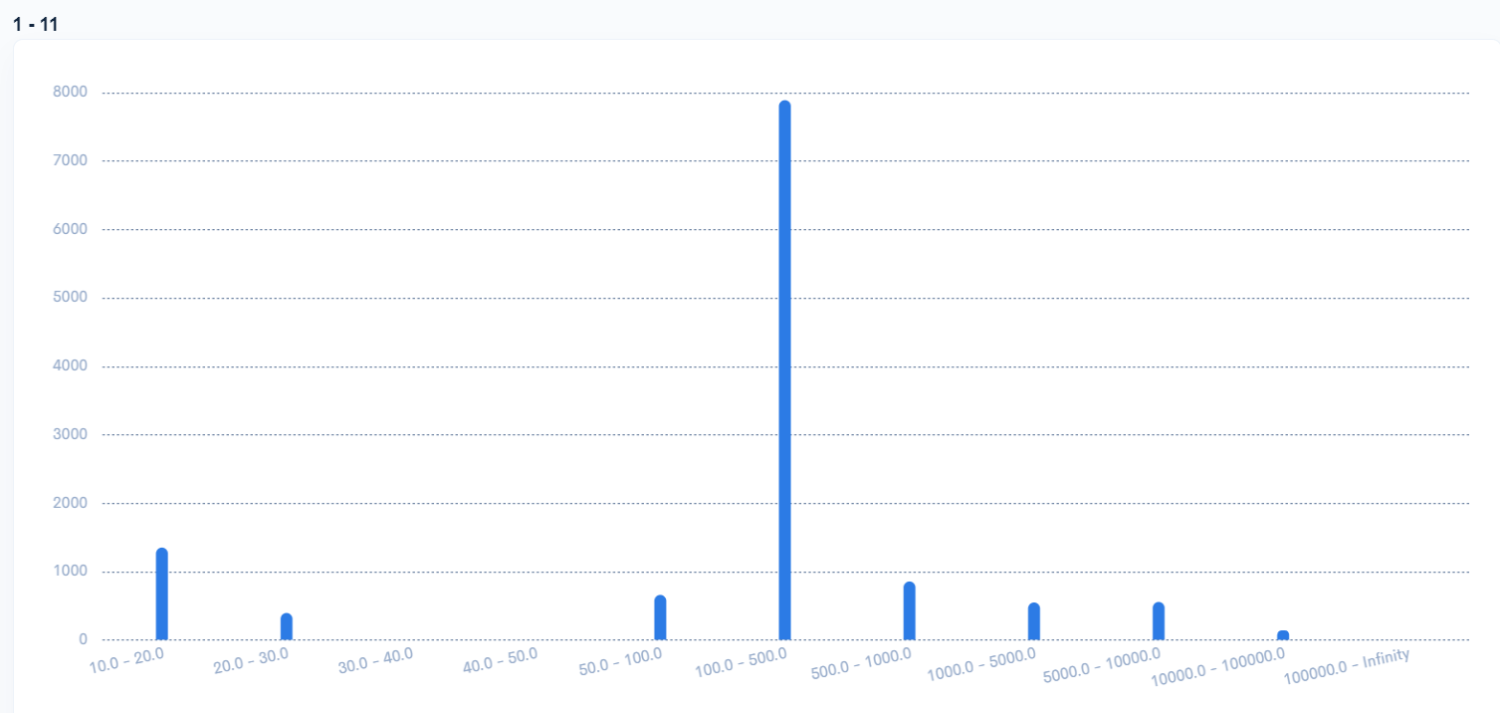
type:Organization locations.country.name:"United States" industries:"Hospitals" not(industries:or("optometrists","home health care","physiotherapy organization", "financial services companies")) name:"Hospital" facet:nbEmployeesMax
As we can see, the lion’s share of the market aligns with our hypothetical energy provider’s customer profile with less than 500 employees. Though there are several thousand hospitals at their higher price point.
At this point we can facet (summary view) our results to provide total counts for both categories.
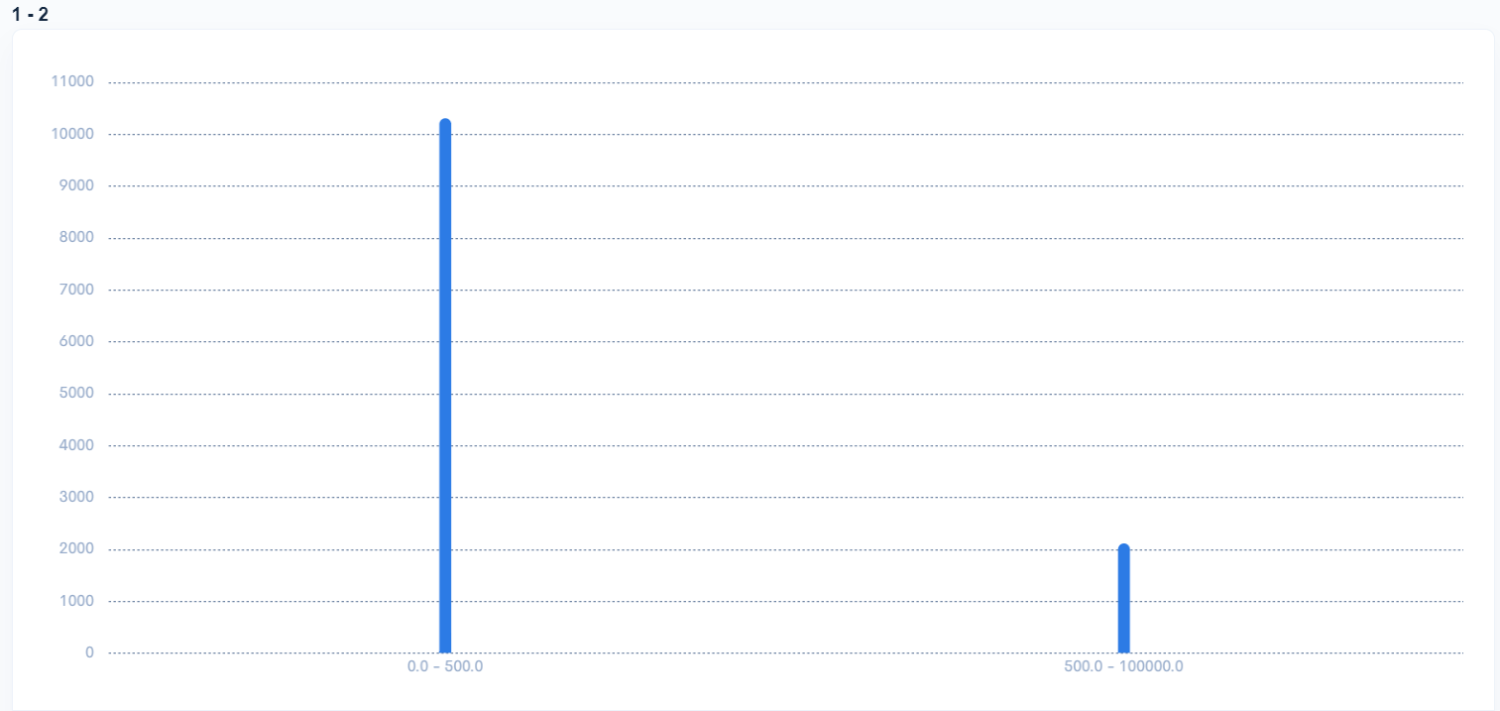
type:Organization locations.country.name:"United States" industries:"Hospitals" not(industries:or("optometrists","home health care","physiotherapy organization", "financial services companies")) name:"Hospital" facet[0:500,500:100000]:nbEmployeesMax
Here an initial take on TAM is simple. Simply multiply your two annual contract values by the number of organizations who could sign up.
- $5,000 x 10,312 = $51,560,000
- $100,000 x 2,121 = $212,100,000
Add the above to find a total addressable market of $263,660,000. Interestingly, the potential value for much smaller subset of larger hospitals vastly outstrips potential earnings for the many small hospitals.
One aspect in which the Knowledge Graph can provide unrivaled granularity is in the ability to quickly provide views of different portions of a TAM calculation. These additional calculations may take the form of your total reachable market or related numbers.
For example, let’s say the above TAM number is solid. But for now you only have legal approval to sell your services in the state of Texas. A quick adjustment to our Diffbot Query Language query can provide us with a TAM bounded by Texas.
type:Organization locations.country.name:"United States" locations.region.name:"Texas" industries:"Hospitals" not(industries:or("optometrists","home health care","physiotherapy organization", "financial services companies")) name:"Hospital" facet[0:500,500:100000]:nbEmployeesMax
Here our TAM or related measure has dropped to $3.78MM.
But let’s say our hypothetical organization is working on approval to sell their goods in five additional states.
type:Organization locations.country.name:"United States" locations.region.name:or("Arizona","Colorado","Utah","New Mexico","Oklahoma") industries:"Hospitals" not(industries:or("optometrists","home health care","physiotherapy organization", "financial services companies")) name:"Hospital" facet[0:500,500:100000]:nbEmployeesMax
The TAM calculable from the above states rounds out at $10.5MM. You can likely begin to see how differing views of segments of TAM can become valuable for discerning opportunity and direction.
Extrapolating From Lists of Customers, Competitors, or Suppliers
A common blocker when entering a new market is the ability to gain a circumspect (and global) view of customers, competitors, and suppliers. Manual research can quickly yield a handful of names. But the ability to extend a dataset can yield datasets of meaningful scale for analysis.
All of the 240MM+ organizations within the Knowledge Graph have a machine learning-computed similarTo score for every other organization. This field looks at a wide range of firmographics to determine what organizations are similar to one another.
Presently the input for similarTo queries can include one or two organizations, so it’s a great way to start with a very small number of example organizations and gain a wider list. To utilize similarTo, you’ll need the DiffbotURI (unique identifier) for the organizations you’re interested in. You can gain this simply by searching by name if you already know of an organization. The final portion of the URL attached to the entity will be your unique identifier.
https://app.diffbot.com/entity/EYX1i02YVPsuT7fPLUYgRhQ
SimilarTo queries then follow the following syntax to yield a range of previously unknown (potential) customers, competitors, or suppliers.
type:organization similarTo(type:organization id:"EYX1i02YVPsuT7fPLUYgRhQ")
💡 Tip: have a moderately-sized list of competitors, customers, or suppliers you want to extrapolate from? Use Diffbot’s Google Sheets or Excel Integrations to perform multiple similarTo queries at once.
A second method by which to grow lists of competitors, customers, or suppliers for further analysis takes a top-down approach. There are a range of filters to create lists of companies by industry, size, revenue, location, and more.
One catch-all approach often utilized in market intelligence queries is to utilize the description field. For example, let’s say you’re looking for suppliers of citric acid within a specific region. Citric acid in-and-of-itself is more granular than typical NAICs industry codes, but we can start from a broader industry and use the description field to find a more targeted list.
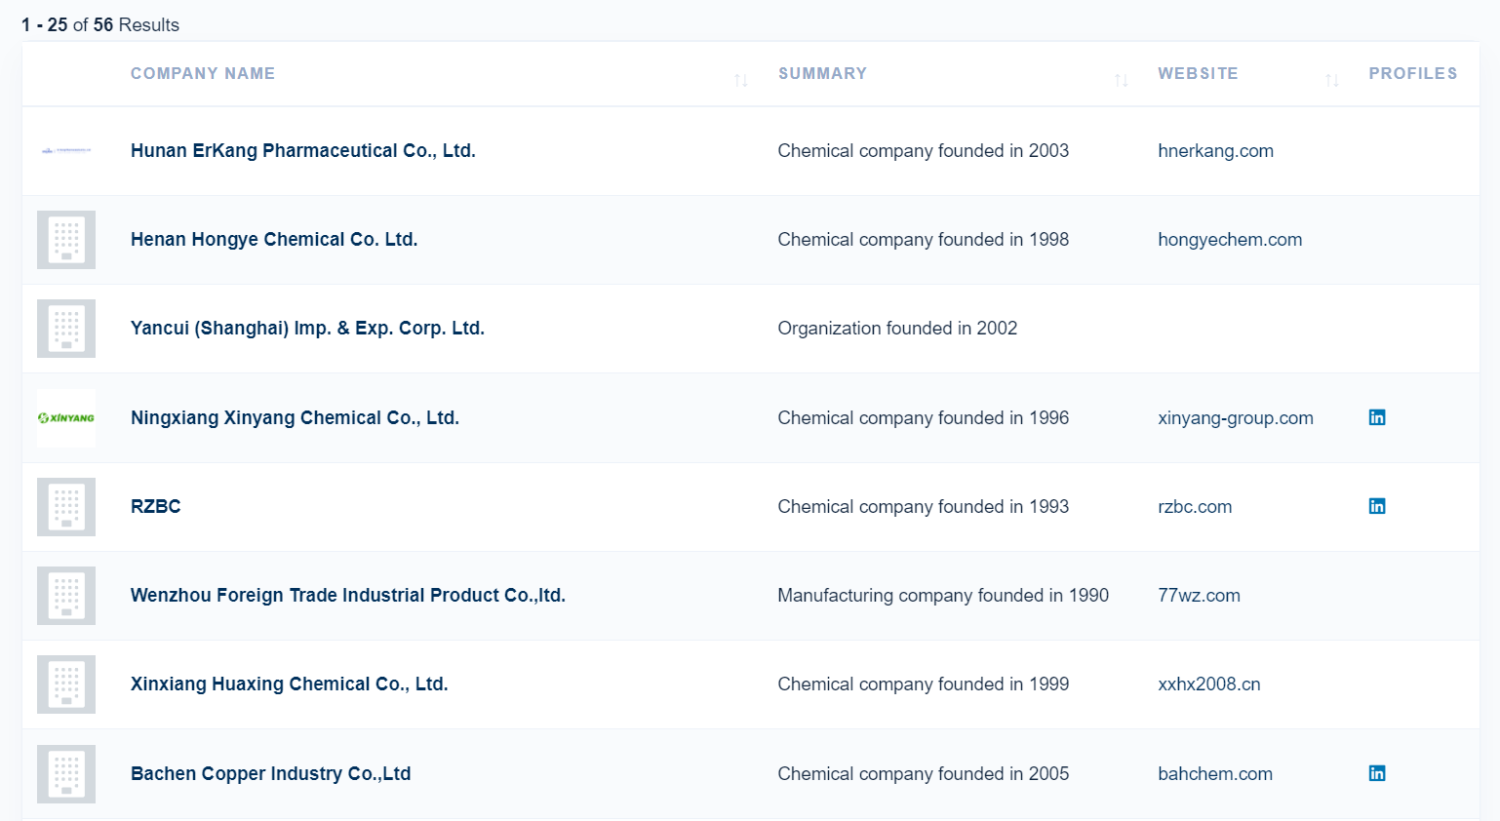
The below query looks for chemical manufacturing companies in China for whom citric acid is central enough to their offerings to be included in their description.
type:Organization industries:"Chemical Companies" location.country.name:"China" description:"citric acid"
At 56 China-based citric acid manufacturer results, you’re well on your way to a comprehensive review of suppliers of interest.
Calculating Market Share And Saturation With Diffbot’s Knowledge Graph
Now that we have a list of competitors as well as TAM-related metrics, we can begin to look at potential market share and saturation rates.
Of the many fact types that our Knowledge Graph extracts from the public web, revenue (or estimated revenue) is one of the most prominent. For organizations that must publicly disclose revenue, this information is almost always online. For organizations who don’t have to publicly disclose, DIffbot provides a machine learning-computed estimated revenue field. This field looks at scores of firmographics to provide a best guess for what present revenue is.
Again we can approach these measurements from a top-down or bottom-up approach. With a discrete list of competitors we can simply enrich data using Diffbot’s Enhance product. Enhance provides Knowledge Graph data by searching for precise matches of organizations or people. Rather than search using a large OR query, Enhance let’s us enrich organizations in bulk.
Alternatively, if you can find a top-down query specific enough to only provide competitors, you can calculate revenue from what is likely an even larger list. If your competition can be defined by clear cut firmographics, then this is a good route. For example, let’s say all alternative energy providers with less than 50 employees in Georgia are competitors.
type:Organization industries:"Renewable Energy Companies" location.region.name:"Georgia" nbEmployeesMax:50
While 150 results is likely a majority of the market segment you’re looking for in this case, you should be aware of data points surrounding your specifications. For example, perhaps 50 employees is a bit arbitrary. And perhaps some competitors you would be remiss to exclude have around 55 employees. A quick facet query can gut check the distribution of data to ensure you aren’t missing out on data slightly beyond the specifications of your search.
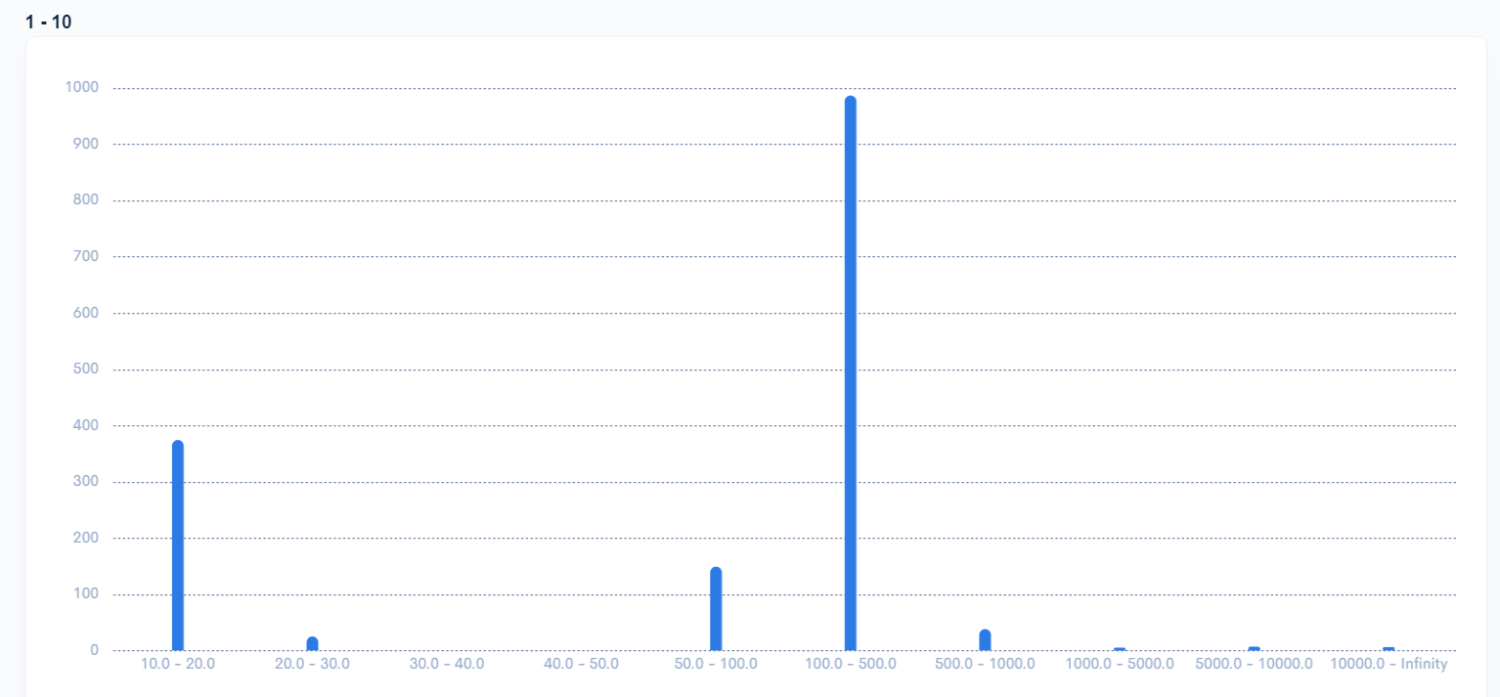
type:Organization industries:"Renewable Energy Companies" location.region.name:"Georgia" facet:nbEmployeesMax
In this summary view of employee counts for renewable energy companies in Georgia you would likely need to rely on industry insight. You could likely exclude 100-500 employee companies as a different segment. But are your competitors truly in the 1-50 employee range (e.g. largely 10-20 employee companies)? Or are your true competitors somewhere in the 50-100 employee bin?
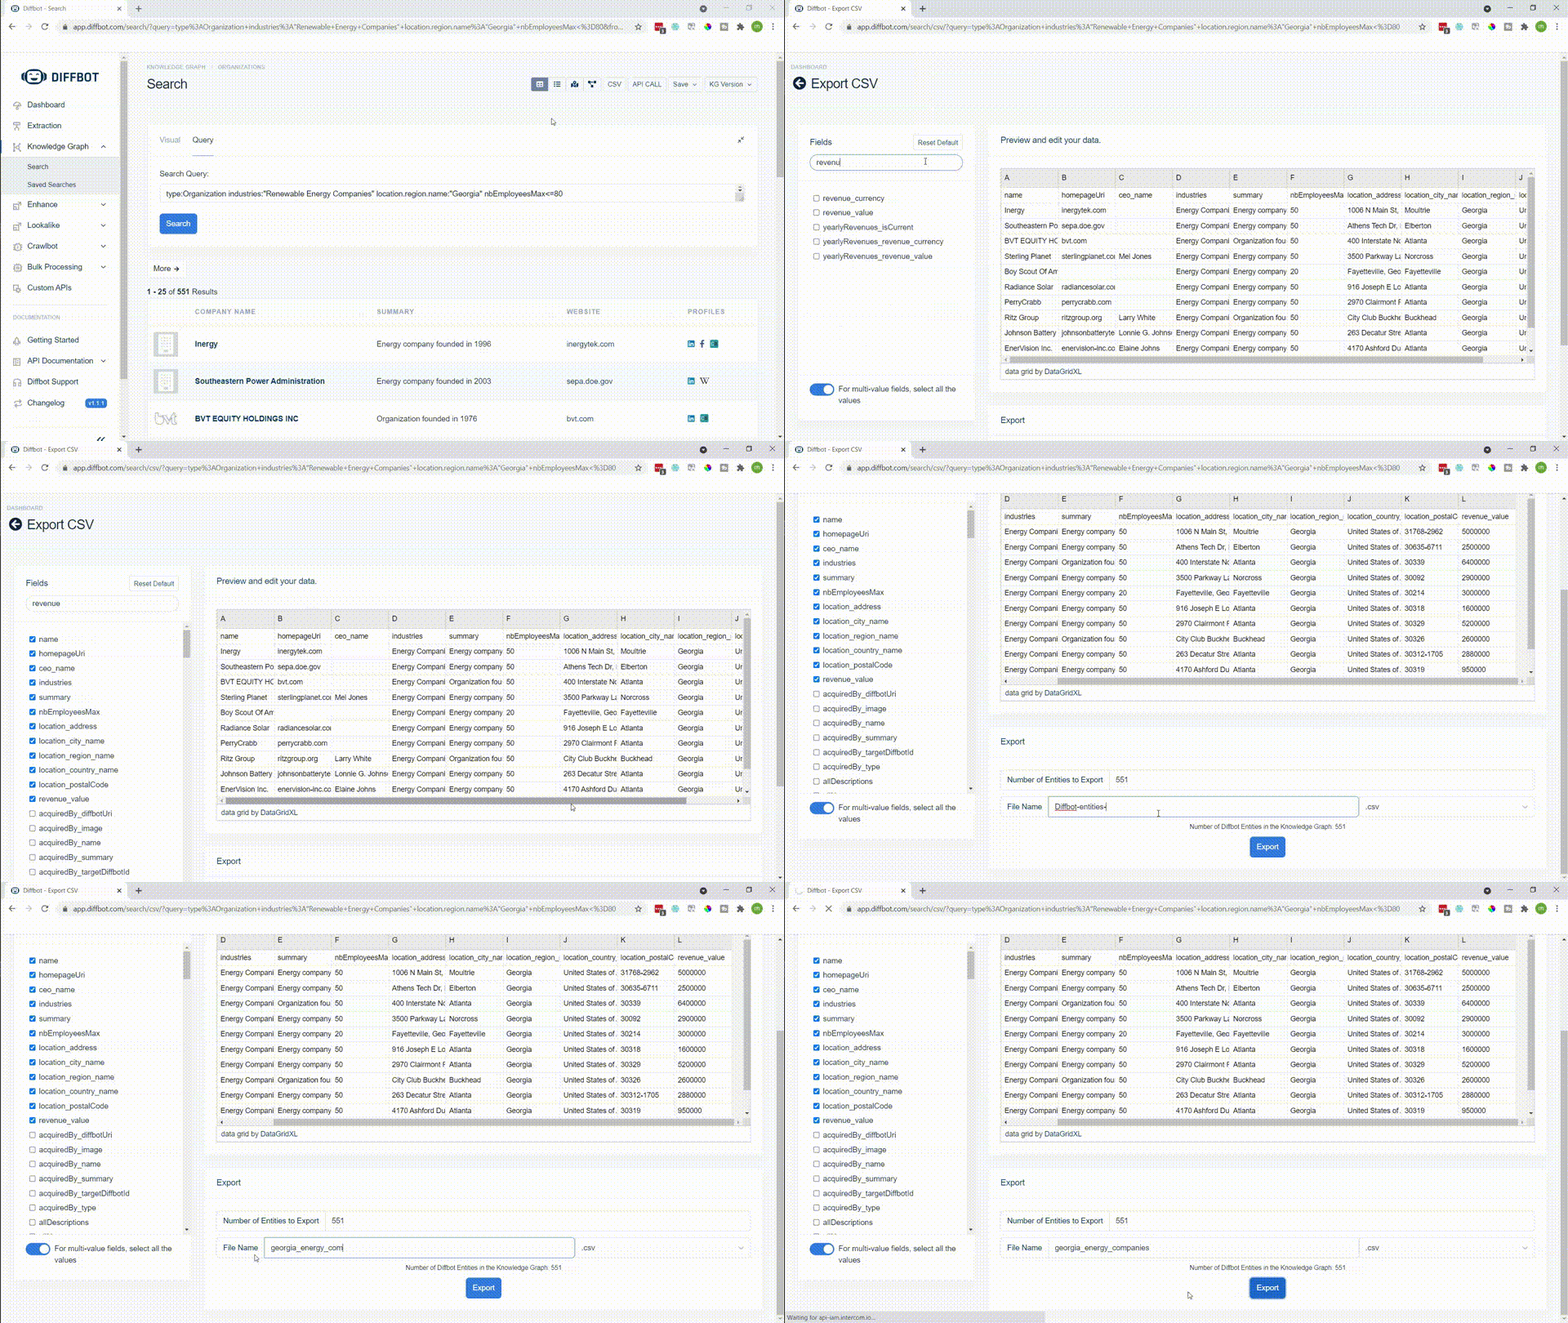
Let’s be safe and export revenue for all companies with less than 80 employees. In the upper right corner of the results screen you can select CSV export, then on the following screen ensure that “revenue value” is toggled.
From this point calculating market share is simple arithmetic.
Ranking Competition With Net Income Per Employee
Ranking competition by net income per employee can point you in the direction of the most mature organizations within your market. This can provide valuable insight into who you should watch, what organizations you can learn from, and what’s working within your market.
We’ve already shown how to export revenue for a range of organizations meeting a specific criteria. The only difference here is you’ll want to export the nbEmployees, nbEmployeesMin, or nbEmployessMax fields to divide by total revenue.
Gauging Organization Sentiment
Thus far we’ve only touched on firmographic-related searches. But a great deal of market intelligence involves analyzing the overall operating environment, future trends, and pending events. This is where news monitoring can come into play. Diffbot’s article index is several times the size of Google News, augmented with natural language processing-enabled fields, and not siloed by location or language.
There are several routes to gaining an article feed of interest. These include:
- Searching articles by AI-generated topical tags (e.g. “show me all articles about Apple Inc”)
- Searching articles by AI-generated categories (e.g. “show me all articles about mergers and acquisitions”)
- Searching articles by publishing location or region (e.g. “show me all articles from these 10 sites” or “show me all articles mentioning petroleum published in Russia”)
In the end, multiple feeds may be consolidated, or portions of the above searches may be combined. Let’s take a look at a feed of mergers and acquisitions related to fintech companies.
type:Article text:"fintech" categories.name:"Acquisitions, Mergers and Takeovers"
💡 Tip: want to find a list of all categories we track across our article index? Be sure to check out our list of categories in our documentation.
Once you have a collection of articles you’re interested in, two useful metrics to track include the velocity of publication as well as the sentiment. In some cases you may want to highlight only positive or negative sentiment, or to showcase a trend surrounding a topic over time.
A facet query can give you a quick distribution of sentiment around a topic. It’s worth noting that there are two “levels” of sentiment within the Knowledge Graph. The first is document-level sentiment, which is visible from within the results page. The second is entity level sentiment. Entity level sentiment provides a view of sentiment pointed at a specific entity within it’s context in an article. While both are valuable, entity-level sentiment is a stronger signal about a precise portion of a story.
One technique to generate a view into the velocity of positive or negative news over a period of time is to facet by publication date for positive (or negative) articles on a topic. A sample query for this looks like the following:
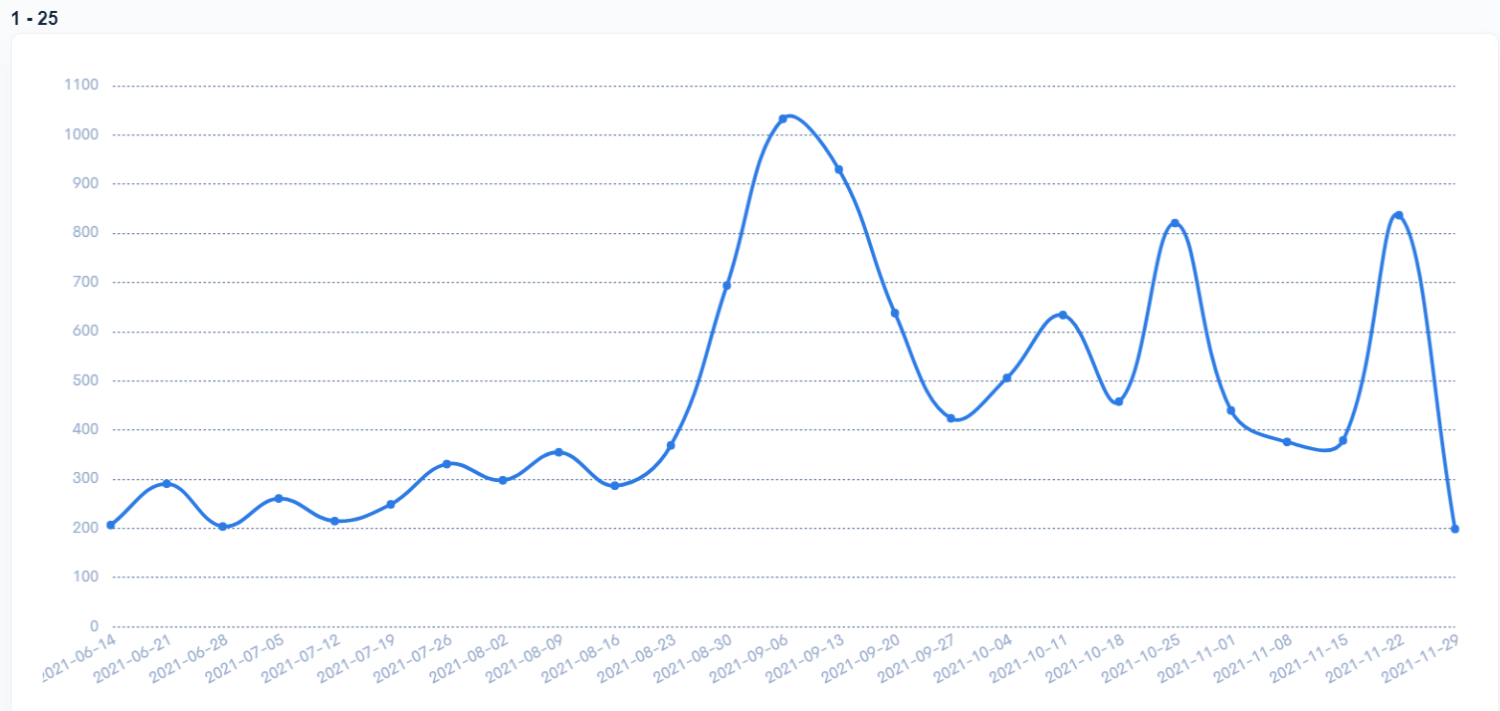
type:Article tags.{uri:"http://diffbot.com/entity/CHb0_0NEcMwyY8b083taTTw" sentiment<0.0} facet[week]:date
As with many facet queries within the Knowledge Graph, the resulting chart is immediately insightful and points to data ranges that might be worth looking into more. In the above example we look at articles tagged with Apple Inc and that are negative sentiment, clustered by week of the last year.
Need to track a custom event across a specific group of articles? You can pass Knowledge Graph or extracted articles to our Natural Language API, which we can quickly help to train to identify custom fact types and entity mentions.
Tracking Shifts In Talent
On top of the 240MM+ organizations in the Knowledge Graph, over 750MM person entities enable detailed employment, skill, and hiring records. There are a few useful market intelligence lenses to evaluate. One simply starts by looking at new or leaving employees at an organization within a time period. Summary views of these individuals can provide a glimpse into what skills, seniority levels, or locations are being hired at.
To begin this type of inquiry, we can use nested queries to ensure not only that a person has an employer we’re looking for, but ALSO that that is their present employer. A query like this looking at individuals working at Meta presently who were hired after the start of 2020 could look like the following.
type:person employments.{employer.name:"Meta" from:"2020-01-01" isCurrent:true}
A quick facet by skills, locations, or job categories can give a high level view of what transitions are happening across organizations.
Market Intelligence Dashboards With Diffbot
While the techniques covered above can help you to quickly generate a static market intelligence report, many market intelligence users want data that updates in real time. We’re constantly crawling the web and update the entirety of our Knowledge Graph every few days. Additionally, the use of our Automatic Extraction APIs can enable you to extract facts as often as you like from a predefined set of domains.
Customer built or custom solutions provided on our end often center around finding a set of Knowledge Graph queries that you truly care about. Datasets that you want to know the moment they change. And feeds that draw from both custom sets of domain, internal documents put through NLP, and the structured article and organization entities of the Knowledge Graph.
Above is a demo dashboard (filled with non-demo data) for a fitness software startup. We pull in many queries similar to those we have worked through in this guide as well as custom crawling of domains and additional parsing via NLP. Together this provides a nearly-live view of topics, discussions, and firmographic changes of competitors and customers within a market! For more information on custom build market monitoring dashboards using Diffbot’s structured web data projects, reach out to sales.
You must be logged in to post a comment.