Skip Ahead
Data on the talent distribution at organizations is available across the public web. Github, Crunchbase, personal blogs, press releases, and LinkedIn profiles (among others) can lead to insights into hiring, firing, and skill sets.
Historically, tracking tenure or attrition data across large organizations required a ton of manual fact accumulation or commissioning a market intelligence report.
Today, this information can be read by web-reading bots. Diffbot is one of three North American organizations with a claim to crawling the entire web. And our bots extract relevant facts about organizations, people, skills, and more. These facts are then incorporated into the world’s largest commercial Knowledge Graph (try it out for two weeks free today).
In this guide we’ll look at how you can gain tenure and attrition data for organizations in the Knowledge Graph. As some organizations can be quite large, we’ll talk through topics like monitoring the number of calls you’re making to conserve search credits, as well as how you can segment through portions of an organization (e.g. ‘tenure for engineers’ or ‘tenure for management’).
Prerequisites
- A trial or paid account for Diffbot’s Knowledge Graph
- For average tenure, knowledge of Python or willingness to follow along with our step-by-step instructions and template script
- For attrition, willingness to follow along in our visual Knowledge Graph search interface with step-by-step instructions
- The name of an organization you’re interested in tracking tenure or attrition for
Tracking Average Tenure At An Organization In Diffbot’s Knowledge Graph
We’ve set up a Google Colaboratory notebook that you can copy to begin your investigation. Why do we need Google Colab and a script? Because some particularly large organizations can have tens or hundreds of thousands of employees (person entities in our Knowledge Graph). We’ll need to wrangle the start and (potential) end dates of their employments to calculate tenure. It’s simply easier to wrangle that much data with our Knowledge Graph API and a short script.
If you’re unfamiliar with Google Colab or Jupyter Notebooks, you run individual blocks of code by pressing the play button to the left of each block. You’ll need to start by running the first block of code (above) which imports all dependencies needed for the project.
Next you can see that we have two additional blocks of code. They both make API calls to our Knowledge Graph API but return slightly different data. The first returns the average tenure of all employees (person entities) past a certain date at a specific organization. The second returns tenure for a specific job function within an organization.
To begin, you’ll need to locate your token. This will grant you API access to the Knowledge Graph. Your API token can be viewed by clicking the “API Token” button in the top right hand corner of the Diffbot Dashboard.
Copy your full token from the top line of the page that loads and paste this into the two lines within the Google Collab that start with TOKEN= between the quotation marks.
Next we can choose the organization we want to track as well as the date we want to start our inquiry. In other words, if the company has a long history, do you want to see average tenure after a specific date? Note that you’ll need to keep the date field in single quotes inside of double quotes (as it is originally presented). Additionally, the date format used is YYYY-MM-DD.
Notice that our variable entities_to_return is set to one. So as to be mindful of Knowledge Graph API credit usage, we’ll use our initial query to only return full data on one entity (a single person). Once you click the “play” button to run the code, you should see some output at the bottom of this block of code. If you tried Microsoft for the dates I’ve entered, you should see the following.
{'version': 1, 'hits': 90419, 'results': 1, 'kgversion': '235',...
What we’re looking for here is the “hits” number. This is the total number of entities matching our query. So in the case of this example, there are 90,419 person entities who have worked at Microsoft since the first day of 2017. For very large organizations, loading this much data can take some time (and consume many credits), so you’ll need to decide whether you want to shift the timeframe you’re looking at or the number of credits are justified. For your trial run, you can also just try a smaller organization to conserve credits.
Once you have a timeframe and organization you think will lead to an interesting insight, take the value after 'hits': and use it to replace 1 in the entities_to_return variable.
Next you’ll want to comment out the line that says print(response). This will avoid a memory error attempting to print the entire output of of queries for large organizations. To comment out a line, simply add # in front of it.
Next click run, a query returning data on thousands of employees may take some time. But most organizations should be quite quick.
If you’ve followed all the steps above, your results should populate the bar below the block of code you just executed!
To obtain tenure by category of employment, skip to the next block of code.
Our process here is the same as the above with one addition, you’ll want to replace the employment category. You can gain a view of all of our employment categories within our Knowledge Graph search dashboard.
- Select person entity
- Select filter by employment then categories
- Browse a list of job functions
Once you’ve inputted an organization, a date, and a category of employment, click run.
Like our previous example, we’ll evaluate the number of ‘hits’ (person entities showing up in results). If you’re satisfied with the number to evaluate, comment out the print statement detailed in the past example and place the ‘hits’ number as the value for the entities_to_return variable. Then run the code to see the average tenure for workers in a specific work function.
You’re done! Want to utilize the same script to calculate average tenure for segments of employees other than these? Familiarize yourself with Diffbot Query Language and craft a person entity query of your own. Place this value inside of the line of code starting with query =.
Calculating Attrition At An Organization In Diffbot’s Knowledge Graph
The point of the script in the last example was largely just to work with large numbers of dates for the start and end of person entity employments. In this example, we simply want absolute numbers for headcount and employees who have left. These are numbers we can find directly within the visual search interface for the Knowledge Graph.
Because attrition is measured across a time period, you may want to look for how many employees an organization had at the start of a given period. Organization entities within the Knowledge Graph have a field noting their present headcount. But for a specific date in the past we’ll be looking at the employment fields attached to person entities.
Let’s say you want to see attrition for all employees at Netflix since 2015. You can copy the following query to gain those employed before 2016.
type:Person employments.{employer.name:"Netflix" from<"2016-01-01" or(to>"2016-01-01", not(has:to))}
The curly braces in this example are an example of a nested query (learn more here). In this case we’re saying return all person entities who both have an employer named Netflix and were employees there from before the first day of 2016.
The final “or” statement is expressing the fact that we want results returned who worked at Netflix at least into the start of 2016, and to include individuals who don’t have an employed “to” (e.g. last day or work) value. This last portion excludes individuals who worked before 2016 but also left before 2016.
The results include 3,324 employees at Netflix (as of 2016-01-01). For this investigation this can be our baseline to see the percentage of attrition.
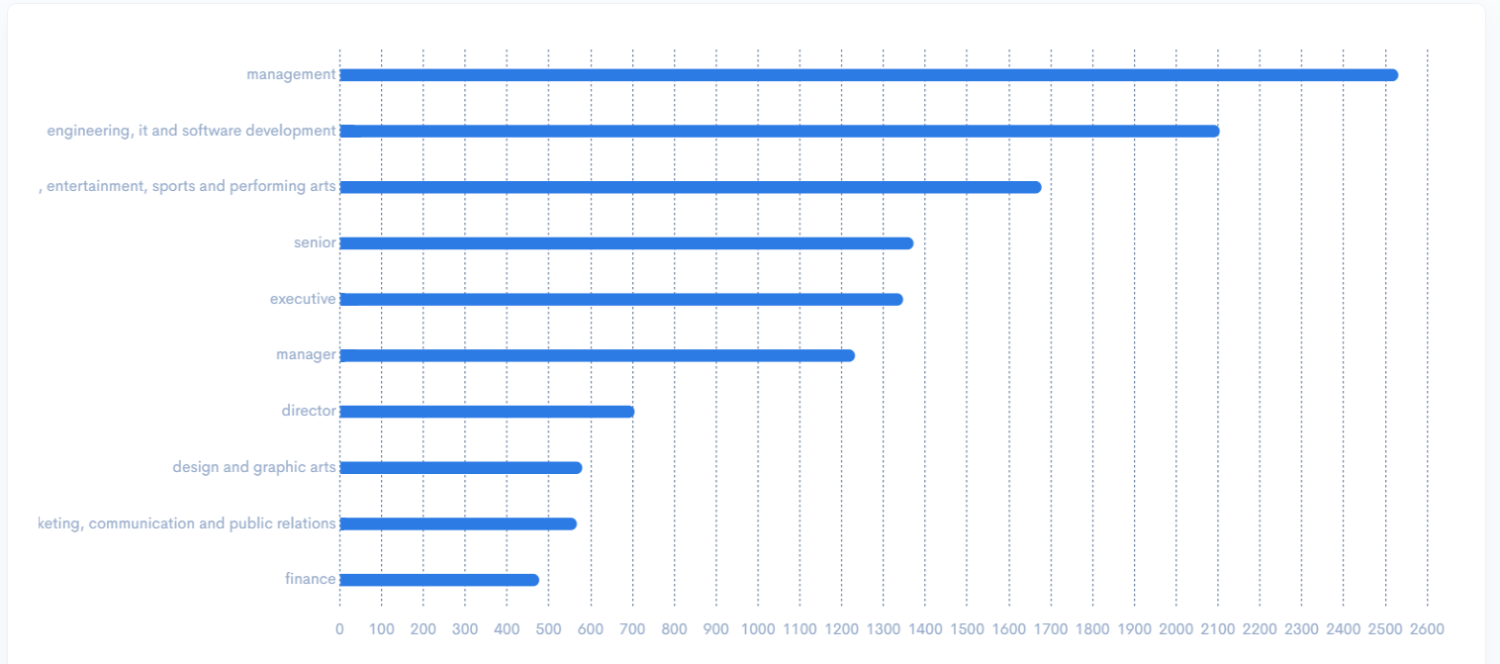
To see what the makeup of the org was at this point, feel free to add facet:employments.categories.name to the end of the query. This results in a breakdown of the employment category of Netflix at this point in time.
Next we simply alter our query slightly to see who has left. This time we want to see employees who worked at Netflix as of the first day of 2016, but later left. We can do this simply by removing not(has:to) and replacing it with has:to. This is specifying that we want individuals who have a “to” (ending) date to their employment.
This query would look like the following:
type:Person employments.{employer.name:"Netflix" from<"2016-01-01" to>"2016-01-01" has:to}
1,289 of the original cohort have left since 2016. Or an attrition rate of ~39%.
By adding the same facet query to the end, we can see which roles within this cohort have had the most (or least) attrition.
Perhaps interestingly, attrition rates largely follow the general distribution of talent in our original cohort. In short, there isn’t a major branch of the business with disproportionately high attrition.
You can perform queries on attrition within particular roles by removing the portion of the query about categories and replacing this with employments.employer.title:"Title of Job".
Additionally of note is that above we’re working through the attrition of a particular hiring cohort(s) (pre-2016 hires). Obtaining a raw look at attrition over a time period is a simpler query.
In the case of Netflix, they’ve performed the bulk of their hiring since 2016. So total attrition numbers may be more informative than looking at a 2016 baseline.
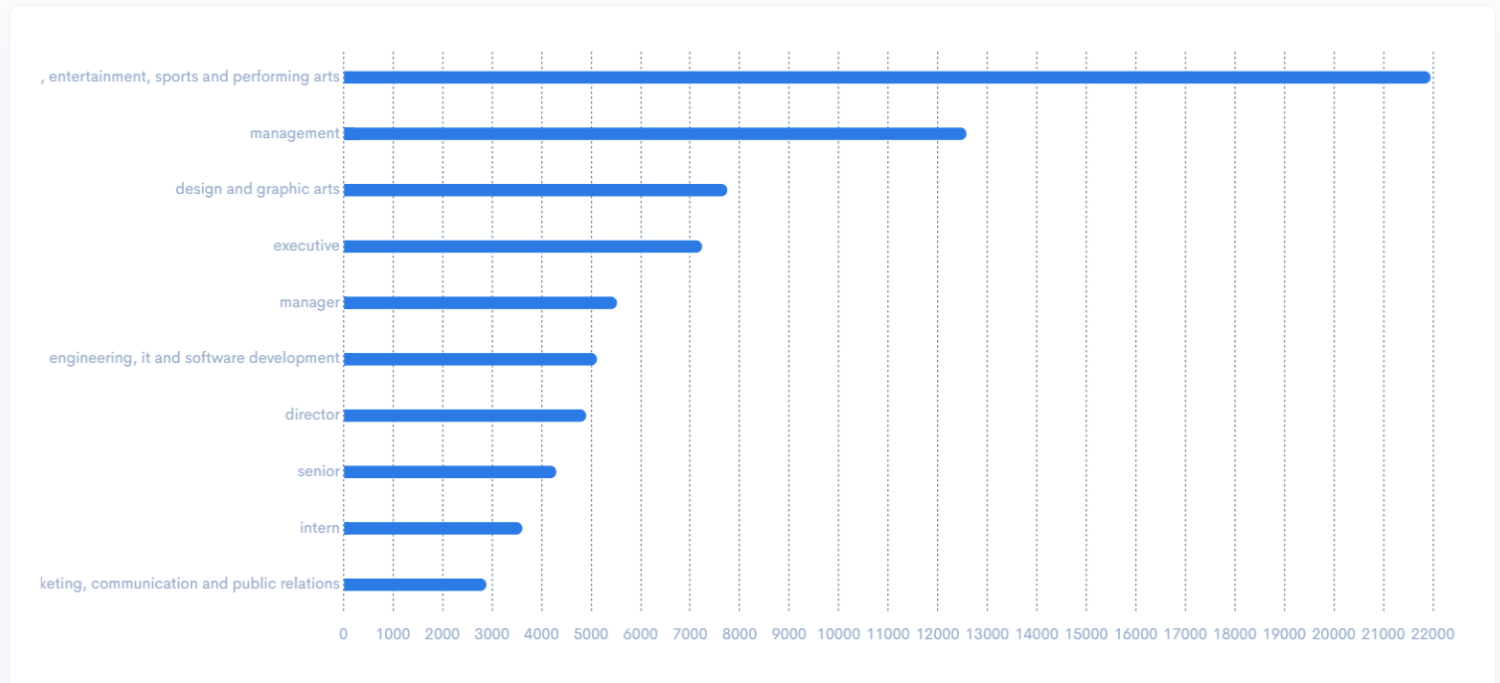
The query format for obtaining a list of all individuals who have left an employer since a specific date can be found thus: type:Person employments.{employer.name:"Netflix" to>"2016-01-01" has:to}
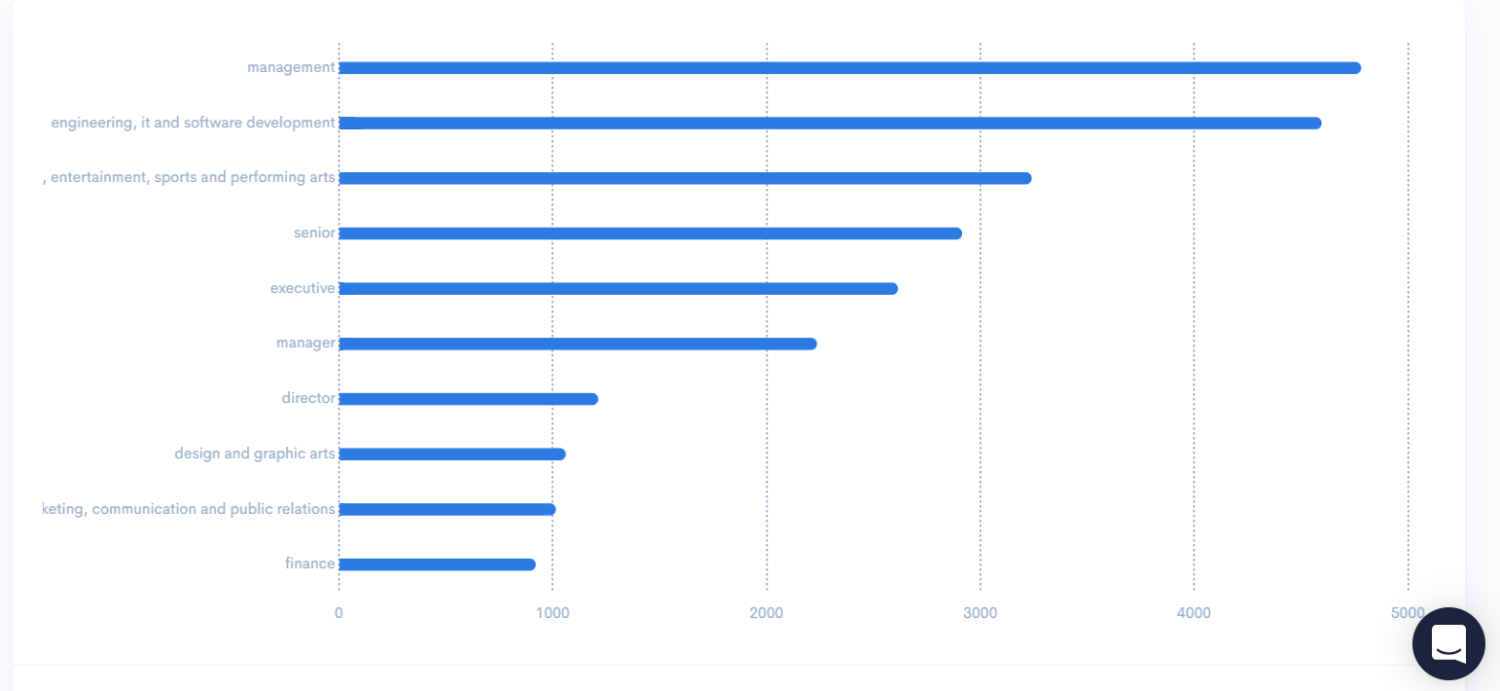
This query results in 7,555 person entities returned. And what we’re looking at here are individuals employed at any point after 2016 for Netflix who have left.
The same facet query used above for this query shows us turnover is largely among performers and entertainment roles, followed by management and design.
So there we have it! The ability to calculate attrition and tenure for individuals working at any of the hundreds of millions of organizations within the Knowledge Graph. For hiring data, note that you can invert from and to dates to see new additions to organizations.
Looking for more examples of market intelligence, competitive intelligence, and firmographic Knowledge Graph queries, be sure to check out our guide to market intelligence search queries!
You must be logged in to post a comment.